
Research & field results
What’s been tested, how, and what it means
Results below are reported test findings under specific conditions, not guaranteed outcomes for every installation. Full reports are available on request.
Field test · Grid Catalyst 2025 Demonstration Cohort
GPU performance per watt in an operating data center
- What was tested
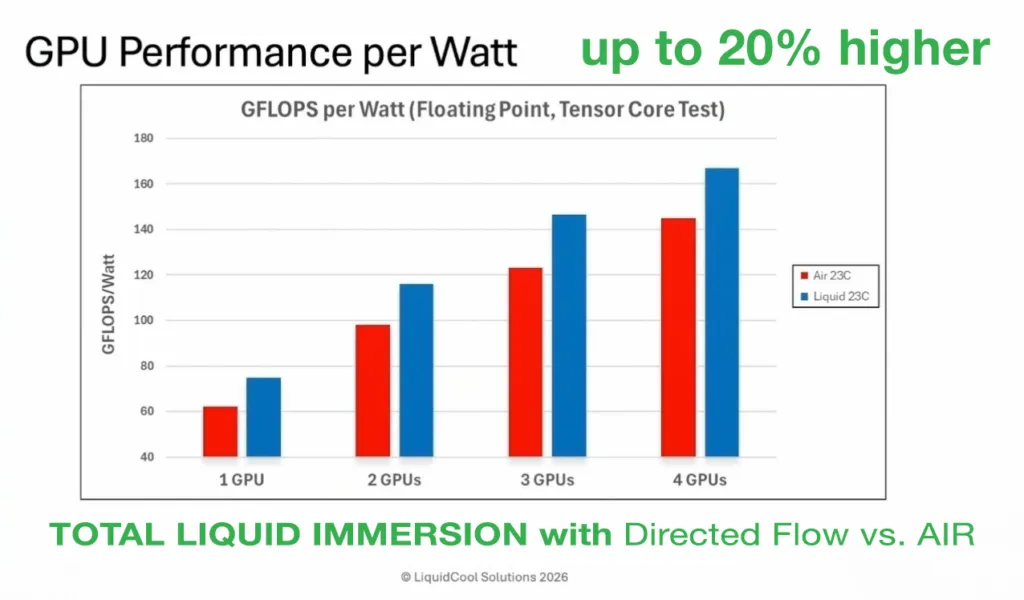
- A GPU server system cooled with TIDF, compared with air cooling, measured in GFLOPS per watt on a floating-point tensor-core test across one to four GPUs (per the LCS results chart).
- Where
- With Grid Catalyst program partner Vaultas; LCS presented the system and results at Vaultas Data Center in Alexandria, Minnesota.
- Reported finding
- LCS reports GPU performance per watt up to 20% higher with TIDF than with air cooling.
- What it means, and doesn’t
- A higher GFLOPS-per-watt figure suggests GPUs can do more work per unit of energy when kept cooler. It is an observed result for the tested configuration; results will vary with hardware, workload, and site. Detailed test conditions are in the full report, which has not yet been summarised here.
Technical evaluation · National Renewable Energy Laboratory
NREL technical evaluation
LCS reports that NREL’s technical evaluation showed cooling PUEs of 1.03 and heat-recovery efficiencies of 90–95%. According to LCS, NREL referred to the technology as the “gold standard” for cooling building-connected data centers, citing that air cooling is eliminated, 100% of server heat is removed in the liquid, and high-quality heat that would otherwise be wasted could be captured and reused.
The report title, publication date, tested configuration, and conditions will be summarised here once the document is supplied. Until then, these figures are presented as LCS’s summary.
Request the NREL evaluation
Recognition
- Solar Impulse Efficient Solution (2021). LCS states it was certified by the Solar Impulse Foundation in 2021 as a provider of profitable, efficient clean-technology solutions.
- Grid Catalyst 2025 Demonstration Cohort. LCS was selected in March 2025 to demonstrate its technology with partner Vaultas.
Transparency
Claims register
Every prominent figure used on this site, its source, what it measures, and what remains to be confirmed.
| Claim | Source | Date | Product | Definition | Baseline | Limitations | Status |
|---|---|---|---|---|---|---|---|
| Up to 4 kW per server | liquidcoolsolutions.com (home, technology, ZPServer pages) | Undated | ZPServer (2U) | Server power density, the ZPServer page says “per standard rack unit”, other pages say “per server” | n/a | Whether the figure is per 2U server or per 1U is unresolved; this site uses “per server” pending confirmation. | Conflicting |
| Cooling PUE <1.03 | ZPServer page; NREL technical evaluation (as summarised by LCS) | NREL report date to confirm | ZPServer | Cooling-system PUE, not whole-facility PUE | n/a | Report available on request; test configuration to be summarised from the report. | Needs confirmation |
| Cooling PUE <1.04 | Small-Scale Solution page | Undated | Small-Scale Solution | Cooling-system PUE | n/a | Test conditions not published. | Needs confirmation |
| Heat-recovery efficiency 90–95% | LCS news post referencing the NREL evaluation | 2025-03-20 (post) | Not stated | Share of server heat captured in the liquid | n/a | Captured ≠ reused. Other pages state “up to 98%” and “more than 90%”. | Conflicting |
| Up to 20% higher GPU performance per watt vs. air | Grid Catalyst field test report (gated) | 2025–2026; exact date to confirm | GPU server system used in the Grid Catalyst demonstration | GFLOPS per watt, floating-point tensor-core test, 1–4 GPUs (per LCS chart) | Same system air-cooled (per LCS chart legend) | Underlying report not reviewed for this site; observed test result, not a guaranteed outcome. | Needs confirmation |
| Cooling power reduced by 98% vs. air | Benefits page | Undated | Not stated | Cooling power only | Air cooling, reference system not stated | Not a total IT or facility energy reduction. | Needs confirmation |
| Footprint reduced by 70% | Benefits page | Undated | Not stated | Floor area for equivalent compute | Air-cooled racks, density not stated | Baseline needed. | Needs confirmation |
| 9.5 sq ft per rack vs. 22 sq ft per tank | Technology page | Undated | Rack of ZPServers vs. immersion tank | Floor space at equal compute density | Unspecified tank system | Tank model and density to confirm. | Needs confirmation |
| About 1/3 the fluid of tanks | Home and technology pages | Undated | ZPServer chassis | Fluid volume at equal compute | Unspecified tank system | Baseline needed. | Needs confirmation |
| Patent count | Home (63), technology (65), about and Oct 2025 press release (69) | Various | Company | Patents held, possibly including pending | n/a | Not stated on this site until a current figure is confirmed. | Conflicting |
| Liquid cools 1,000× (or 1,400×) better than air | Technology page (1,000×); MiniNODE page (1,400×) | Undated | General | Heat-transfer capability, property not specified | Air | Two different multipliers in use; the site cites 1,000× as “roughly”. | Conflicting |
| E-waste reduced by 30% | Benefits page | Undated | Not stated | Not defined | Not stated | Basis needed. | Needs confirmation |
Next step
Let’s solve your cooling challenge.
Tell us about your workload, site, and timeline. An LCS engineer will help you assess whether rack-based immersion fits your infrastructure.